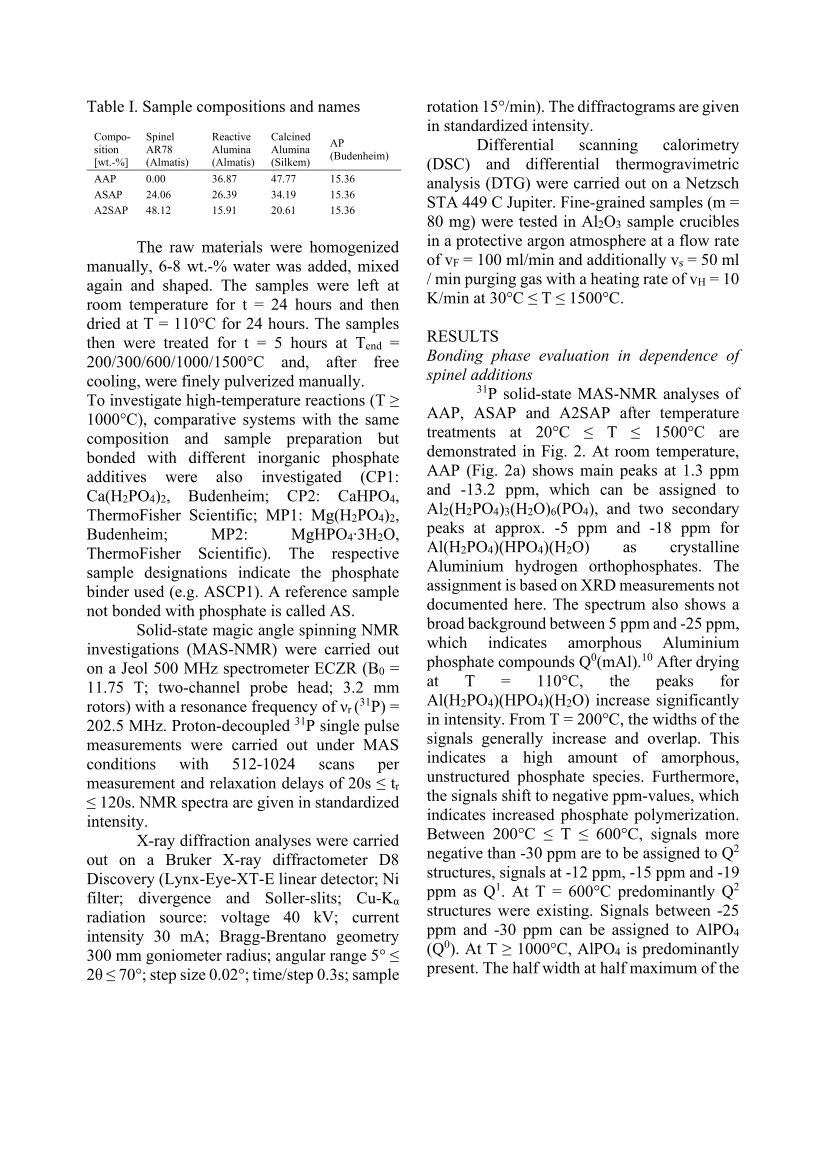
Table I. Sample compositions and names Compo- sition [wt.-%] Spinel AR78 (Almatis) Reactive Alumina (Almatis) Calcined Alumina (Silkem) AP (Budenheim) AAP 0.00 36.87 47.77 15.36 ASAP 24.06 26.39 34.19 15.36 A2SAP 48.12 15.91 20.61 15.36 The raw materials were homogenized manually, 6-8 wt.-% water was added, mixed again and shaped. The samples were left at room temperature for t = 24 hours and then dried at T = 110°C for 24 hours. The samples then were treated for t = 5 hours at Tend = 200/300/600/1000/1500°C and, after free cooling, were finely pulverized manually. To investigate high-temperature reactions (T ≥ 1000°C), comparative systems with the same composition and sample preparation but bonded with different inorganic phosphate additives were also investigated (CP1: Ca(H2PO4)2, Budenheim CP2: CaHPO4, ThermoFisher Scientific MP1: Mg(H2PO4)2, Budenheim MP2: MgHPO4∙3H2O, ThermoFisher Scientific). The respective sample designations indicate the phosphate binder used (e.g. ASCP1). A reference sample not bonded with phosphate is called AS. Solid-state magic angle spinning NMR investigations (MAS-NMR) were carried out on a Jeol 500 MHz spectrometer ECZR (B0 = 11.75 T two-channel probe head 3.2 mm rotors) with a resonance frequency of νr (31P) = 202.5 MHz. Proton-decoupled 31 P single pulse measurements were carried out under MAS conditions with 512-1024 scans per measurement and relaxation delays of 20s ≤ tr ≤ 120s. NMR spectra are given in standardized intensity. X-ray diffraction analyses were carried out on a Bruker X-ray diffractometer D8 Discovery (Lynx-Eye-XT-E linear detector Ni filter divergence and Soller-slits Cu-Kα radiation source: voltage 40 kV current intensity 30 mA Bragg-Brentano geometry 300 mm goniometer radius angular range 5° ≤ 2θ ≤ 70° step size 0.02° time/step 0.3s sample rotation 15°/min). The diffractograms are given in standardized intensity. Differential scanning calorimetry (DSC) and differential thermogravimetric analysis (DTG) were carried out on a Netzsch STA 449 C Jupiter. Fine-grained samples (m = 80 mg) were tested in Al2O3 sample crucibles in a protective argon atmosphere at a flow rate of vF = 100 ml/min and additionally vs = 50 ml / min purging gas with a heating rate of vH = 10 K/min at 30°C ≤ T ≤ 1500°C. RESULTS Bonding phase evaluation in dependence of spinel additions 31 P solid-state MAS-NMR analyses of AAP, ASAP and A2SAP after temperature treatments at 20°C ≤ T ≤ 1500°C are demonstrated in Fig. 2. At room temperature, AAP (Fig. 2a) shows main peaks at 1.3 ppm and -13.2 ppm, which can be assigned to Al2(H2PO4)3(H2O)6(PO4), and two secondary peaks at approx. -5 ppm and -18 ppm for Al(H2PO4)(HPO4)(H2O) as crystalline Aluminium hydrogen orthophosphates. The assignment is based on XRD measurements not documented here. The spectrum also shows a broad background between 5 ppm and -25 ppm, which indicates amorphous Aluminium phosphate compounds Q0(mAl).10 After drying at T = 110°C, the peaks for Al(H2PO4)(HPO4)(H2O) increase significantly in intensity. From T = 200°C, the widths of the signals generally increase and overlap. This indicates a high amount of amorphous, unstructured phosphate species. Furthermore, the signals shift to negative ppm-values, which indicates increased phosphate polymerization. Between 200°C ≤ T ≤ 600°C, signals more negative than -30 ppm are to be assigned to Q2 structures, signals at -12 ppm, -15 ppm and -19 ppm as Q1. At T = 600°C predominantly Q2 structures were existing. Signals between -25 ppm and -30 ppm can be assigned to AlPO4 (Q0). At T ≥ 1000°C, AlPO4 is predominantly present. The half width at half maximum of the
(c) 2024 American Ceramic Society. All Rights reserved.


