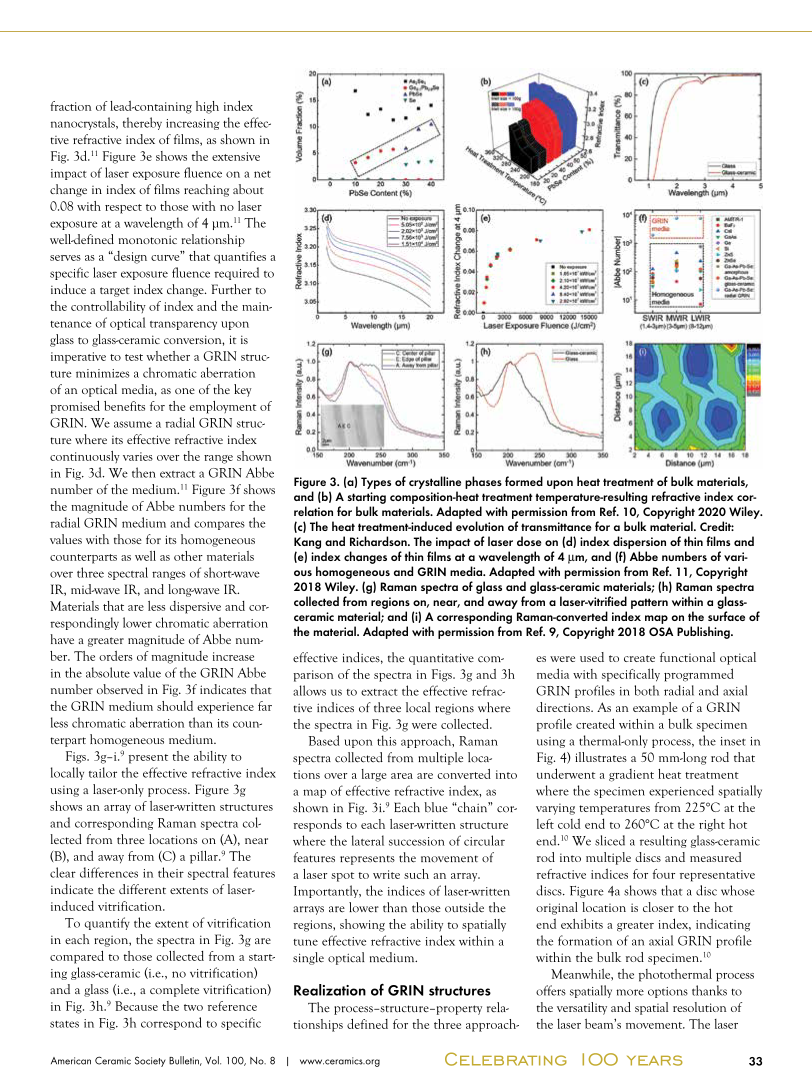
33 American Ceramic Society Bulletin, Vol. 100, No. 8 | www.ceramics.org Celebrating 100 years fraction of lead-containing high index nanocrystals, thereby increasing the effec- tive refractive index of films, as shown in Fig. 3d.11 Figure 3e shows the extensive impact of laser exposure fluence on a net change in index of films reaching about 0.08 with respect to those with no laser exposure at a wavelength of 4 µm.11 The well-defined monotonic relationship serves as a “design curve” that quantifies a specific laser exposure fluence required to induce a target index change. Further to the controllability of index and the main- tenance of optical transparency upon glass to glass-ceramic conversion, it is imperative to test whether a GRIN struc- ture minimizes a chromatic aberration of an optical media, as one of the key promised benefits for the employment of GRIN. We assume a radial GRIN struc- ture where its effective refractive index continuously varies over the range shown in Fig. 3d. We then extract a GRIN Abbe number of the medium.11 Figure 3f shows the magnitude of Abbe numbers for the radial GRIN medium and compares the values with those for its homogeneous counterparts as well as other materials over three spectral ranges of short-wave IR, mid-wave IR, and long-wave IR. Materials that are less dispersive and cor- respondingly lower chromatic aberration have a greater magnitude of Abbe num- ber. The orders of magnitude increase in the absolute value of the GRIN Abbe number observed in Fig. 3f indicates that the GRIN medium should experience far less chromatic aberration than its coun- terpart homogeneous medium. Figs. 3g–i.9 present the ability to locally tailor the effective refractive index using a laser-only process. Figure 3g shows an array of laser-written structures and corresponding Raman spectra col- lected from three locations on (A), near (B), and away from (C) a pillar.9 The clear differences in their spectral features indicate the different extents of laser- induced vitrification. To quantify the extent of vitrification in each region, the spectra in Fig. 3g are compared to those collected from a start- ing glass-ceramic (i.e., no vitrification) and a glass (i.e., a complete vitrification) in Fig. 3h.9 Because the two reference states in Fig. 3h correspond to specific effective indices, the quantitative com- parison of the spectra in Figs. 3g and 3h allows us to extract the effective refrac- tive indices of three local regions where the spectra in Fig. 3g were collected. Based upon this approach, Raman spectra collected from multiple loca- tions over a large area are converted into a map of effective refractive index, as shown in Fig. 3i.9 Each blue “chain” cor- responds to each laser-written structure where the lateral succession of circular features represents the movement of a laser spot to write such an array. Importantly, the indices of laser-written arrays are lower than those outside the regions, showing the ability to spatially tune effective refractive index within a single optical medium. Realization of GRIN structures The process–structure–property rela- tionships defined for the three approach- es were used to create functional optical media with specifically programmed GRIN profiles in both radial and axial directions. As an example of a GRIN profile created within a bulk specimen using a thermal-only process, the inset in Fig. 4) illustrates a 50 mm-long rod that underwent a gradient heat treatment where the specimen experienced spatially varying temperatures from 225°C at the left cold end to 260°C at the right hot end.10 We sliced a resulting glass-ceramic rod into multiple discs and measured refractive indices for four representative discs. Figure 4a shows that a disc whose original location is closer to the hot end exhibits a greater index, indicating the formation of an axial GRIN profile within the bulk rod specimen.10 Meanwhile, the photothermal process offers spatially more options thanks to the versatility and spatial resolution of the laser beam’s movement. The laser Figure 3. (a) Types of crystalline phases formed upon heat treatment of bulk materials, and (b) A starting composition-heat treatment temperature-resulting refractive index cor- relation for bulk materials. Adapted with permission from Ref. 10, Copyright 2020 Wiley. (c) The heat treatment-induced evolution of transmittance for a bulk material. Credit: Kang and Richardson. The impact of laser dose on (d) index dispersion of thin films and (e) index changes of thin films at a wavelength of 4 µm, and (f) Abbe numbers of vari- ous homogeneous and GRIN media. Adapted with permission from Ref. 11, Copyright 2018 Wiley. (g) Raman spectra of glass and glass-ceramic materials (h) Raman spectra collected from regions on, near, and away from a laser-vitrified pattern within a glass- ceramic material and (i) A corresponding Raman-converted index map on the surface of the material. Adapted with permission from Ref. 9, Copyright 2018 OSA Publishing.
(c) 2024 American Ceramic Society. All Rights reserved.


